
The sports betting world is changing fast, thanks to technology. Machine learning has made a big impact, helping with accurate predictions and changing odds. But, live betting is different from betting before the game starts. Odds change with every play, injury, and surprise.
Sportsbooks use advanced algorithms to update odds quickly. Yet, these models are not flawless. They might overreact to a quick score or ignore a key foul. This flaw can be both a chance and a risk for bettors.
If you think watching the game live helps you bet better, you might be wrong. What really sets a smart bettor apart is knowing how odds are made. This guide will show you the real side of live betting.
We’ll look into the data, how it’s used, and the logic behind it. It’s not just about feeling confident while betting. It’s about understanding the science behind it. Are you ready to learn more? Let’s start.
Anatomy of live markets suspensions scoring cadence and book delays
Imagine a game-changing touchdown, and your betting app goes dark. This happens because of latency control by sportsbooks during key moments. They freeze the lines to update their odds. This is a smart move to protect their interests and ensure fair play.
Why sportsbooks freeze lines during critical game states
Suspensions aren’t just annoying. They follow a clear order. A touchdown, a red card, or a last-second shot all cause immediate freezes. This is because the odds change a lot in these moments. The sportsbook needs time to adjust the odds before letting bets.
The suspension trigger hierarchy from touchdowns to injuries
In live betting, not all events are the same. A touchdown might freeze the game right away, while an injury could have a different effect. Knowing this order helps bettors plan their bets better.
Scoring cadence and its effect on odds recalibration windows
Scoring cadence affects how fast odds are updated. In the NFL, the game’s stop-start nature creates good times for updates after each play. The NBA’s fast pace barely gives algorithms time to adjust. Soccer falls in between, posing unique challenges for bettors.
How possession-based sports differ from continuous-play markets
It’s key to know the difference between sports with possessions and those without. Each sport has its own pace. This knowledge can give you an advantage. For example, basketball’s fast pace is different from soccer’s longer plays.
Book delays and the hidden latency tax on every in-play wager
Book delays are a big deal. Every in-play bet has a hidden delay. This delay isn’t just small; it can really affect your betting strategy. When a big event happens, sportsbooks often know before you do. Understanding this gap is important.
Broadcast delay versus data feed delay understanding the gap
Broadcast delays can be quite different. But they often lag behind the data feeds used by sportsbooks. The algorithm gets the info before your TV or streaming service. This means the first price you see after a freeze is often not the best. Waiting a bit can help you find a better line.
https://www.youtube.com/watch?v=-PLOWRNm2dY
Data feeds latency TV vs streams app rendering and sync strategies
In the fast world of live betting, knowing about data feed latency is key. Every second matters, and how fast data gets from the stadium to your screen can change your betting plan. Let’s explore how data feeds affect your live betting models.
The anatomy of a sports data feed from stadium to screen
Imagine the game is on, and your team scores. But how fast does that info get to your betting app? The path from the stadium to your screen uses many technologies. Official league feeds go straight from stadium sensors to sportsbooks. Third-party aggregators take a longer way.
Official league feeds versus third-party aggregators speed comparison
| Feed Type | Average Latency | Data Source | Reliability |
|---|---|---|---|
| Official League Feeds | 1-2 seconds | Stadium Sensors | High |
| Third-Party Aggregators | 3-5 seconds | Multiple Sources | Medium |
| Social Media Updates | 5-10 seconds | User-Generated | Low |
The latency difference is big. Sportsbooks with official feeds have a big advantage. They can change odds before most people see the play.
TV broadcast latency versus streaming app delay what actually matters
Now, let’s talk about watching games. Ever noticed your neighbor’s cable box seems ahead of your YouTube TV? This is a big issue for sports fans and bettors.
Why your neighbor’s cable box might beat your YouTube TV feed
TV broadcasts are often more reliable because of their own network. They don’t have the same problems as streaming apps. Sportsbooks get updates fast from official feeds. This is why odds can change a lot before you see the game.
Sync strategies for aligning multiple data sources in real time
To keep your betting strategy in sync with the game, you need sync strategies. These ensure your data feeds match up. Techniques like event-time ordering and watermarking help keep things accurate.
Event-time ordering watermarking and late-arrival rules explained
Event-time ordering ties your data to the game clock, not your clock. Watermarking stops double-counting of possessions. Late-arrival rules keep late data from messing up your models. This work is key to avoiding betting blind.
In conclusion, knowing about data feed latency and how to manage it is key for live betting. With the right knowledge, you can turn problems into chances. For more on updating your live odds approach, read this article.

State representation down distance timeouts player rotations penalties fatigue
To excel in live betting, mastering state representation is key. Football isn’t just about the score. It’s about the variables that change quickly. Knowing how to create a complete game state vector is vital for bettors.
Building a Complete Game State Vector for Live Betting Models
A game state vector includes variables that show the game’s current state. Here are the main parts:
| Variable | Description | Impact on Betting |
|---|---|---|
| Down | The current down in the game (1st, 2nd, etc.) | Influences play-calling strategies |
| Distance | The yards needed for a first down | Determines offensive tactics |
| Timeouts Remaining | Number of timeouts left for each team | Can change game dynamics, specially late |
| Quarter | Current quarter of the game | Context for scoring urgency |
| Time Remaining | Time left on the game clock | Critical for late-game strategies |
Down and Distance as the Backbone of Football State Estimation
In football, down and distance are critical. A 2nd-and-2 from midfield opens up the playbook. But a 3rd-and-11 from your own 15 calls for desperation. Models that ignore these details will fail.
Timeout Inventory and Its Asymmetric Value Across Game Phases
Timeouts are surprisingly powerful. A timeout with 1:45 left in a close game is priceless. But the same timeout in the first quarter is almost irrelevant. Knowing this can give you an edge.
Why a Timeout in the Final Two Minutes is Worth More Than in the First Quarter
In the final moments, a timeout can change the game. It allows teams to strategize and score better. This is where state representation shines, turning a simple timeout into a key advantage.
Player Rotations, Fatigue Tracking, and Penalty Accumulation as State Variables
Player rotations and tracking fatigue are key. A star player on his 38th minute of play is different from when he started. Tracking fatigue as a continuous feature, not just a flag, gives a more accurate view of player performance.
Encoding Fatigue as a Continuous Feature, Not a Binary Flag
Injuries and fatigue should be seen as probabilistic features. This captures the uncertainty of real-world situations. It lets your model adapt to the game’s fluid nature.
Understanding these state variables can greatly improve your live betting strategy. For more on building effective betting models, see this resource on pregame priors and updates during play.
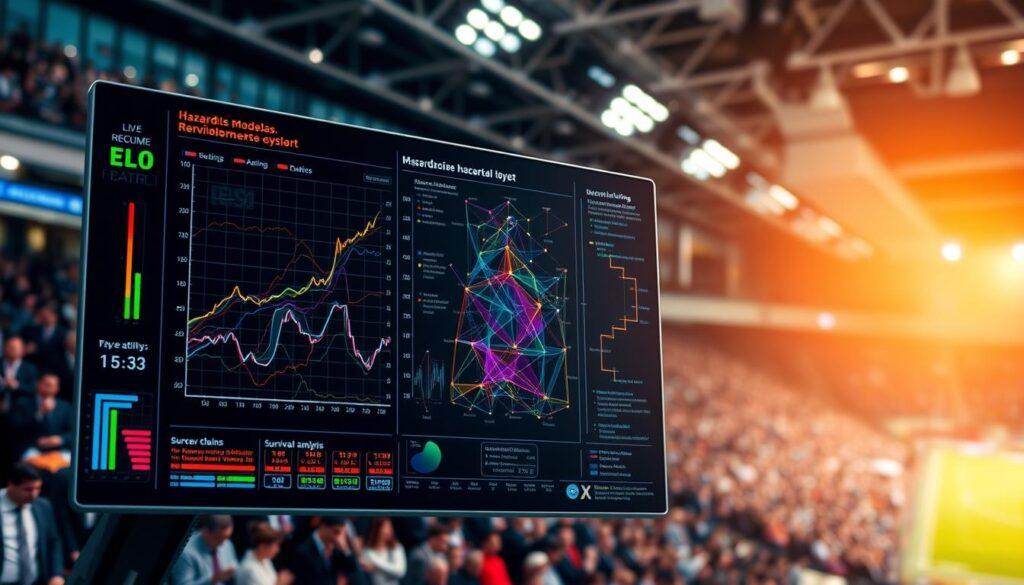
Model classes Markov chains survival hazard models real time ELO
In live betting, model classes are key, not just words. They help shape your betting strategy. Knowing these models can make your wagers smarter.
Markov chains for possession-based state transitions in football and basketball
Markov chains are vital in sports like football and basketball. They break down games into simpler states. The game’s next state often depends on the current one.
Think of a football drive as a Markov process. Each play moves you to a new down, distance, and field position. With the right matrix, you can predict many drive outcomes. But, too many variables can make your model useless.
Transition probability matrices and the curse of dimensionality
Building a transition matrix is tricky. Too many variables make it sparse and useless. Too few might miss important details. Finding the right balance is key.
Survival analysis and hazard models for time-to-event betting markets
Survival analysis and hazard models are for time-to-event betting. They ask, “What’s the chance of the next score in the next 60 seconds?” This is vital for betting on when something will happen.
Hazard models fit in-play betting well. The hazard rate goes up during key moments and drops during slow times. As time runs out, the urgency and hazard rate increase.
Why hazard rates beat point predictions for next-score markets
Hazard models outperform point predictions. They capture the timing of events, not just who scores next. It’s like having a secret advantage in betting.
Real-time ELO systems for dynamic team strength estimation
Real-time ELO systems are simple yet effective. They start with pregame ratings and update them as the game goes on. A big play, like a pick-six, changes the ratings, showing how teams perform.
Bayesian updating of ELO ratings as new in-game information arrives
ELO’s beauty is in its ability to adjust for extreme events. It knows true team strength doesn’t change much in 60 minutes. This makes ELO popular among bettors.
NBA example live totals from pace and efficiency shifts after timeouts
Timeouts in NBA live betting can change the game’s pace and efficiency in big ways. Coaches use timeouts to adjust their strategies and find weaknesses. This can have a big impact, as every second is important in a fast game.
How Coaching Timeouts Reshape Pace and Offensive Efficiency in Real Time
Timeouts are not just for players to rest. They are a chance for teams to change their game plan. This can lead to a big change in how well a team scores, as they might start playing better after the timeout.
The ATO After Timeout Play Effect on Expected Points Per Possession
After-timeout plays (ATOs) are key. They often lead to more points being scored. Coaches plan these plays to take advantage of the defense’s weaknesses, giving bettors a chance to win.
Pace Estimation from Rolling Possession Counts and Lineup Combinations
Knowing the pace of the game is key in live betting. Possession counts show how different lineups play. For example, bench units can make the game faster, which the market often misses.
Why Bench Units Create Predictable Pace Spikes the Market Often Misses
Bench units are often overlooked. They can make the game faster, changing how the game is played. The market uses averages, missing these changes. A model that catches these changes can give bettors an edge.
Building a Live Totals Model That Updates After Every Dead Ball
Creating a live totals model is important for betting. It should update after every stop in play, using real-time data. Things like fatigue and foul trouble can affect the game’s total points.
Incorporating Fatigue, Foul Trouble, and Referee Tendencies into the Over/Under
Fatigue and foul trouble are key in live betting. A player’s foul count can change the game, leading to more scoring chances. By including these factors, your model can be more accurate, helping bettors make better choices.
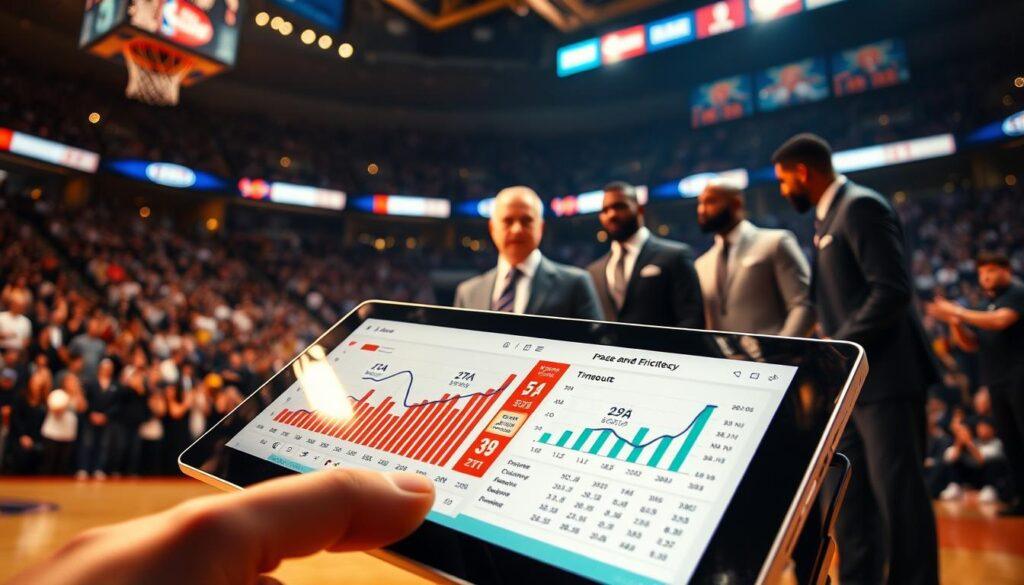
In conclusion, knowing how timeouts affect the game can help in NBA live betting. By using this knowledge, you can make better bets. For more tips, check out this guide.
NFL example 4th quarter moneyline with drive success and timeout value
In the fourth quarter, NFL betting is more than just numbers. It’s a game of strategy and instinct. Understanding drive success and timeout value can give you an edge.
Drive success probability as a function of time remaining and timeouts
When a team is down, the time left and timeouts matter a lot. Imagine a team down by four with three minutes left and two timeouts. The live moneyline might show them at +280, a 26% chance of winning. But a more detailed model might say their real chance is 34%.
This 8-point difference is where you can win. It’s your chance to beat the odds.
The two-minute drill as a distinct state with its own probability surface
The two-minute drill changes the game. Defenses try to prevent scoring, giving offenses a chance to act fast. A model that doesn’t account for this can be off.
The difference between a good two-minute drill and a regular drive is huge.
Timeout value asymmetry in late-game comeback scenarios
Timeout value asymmetry is often overlooked. Being down by six with three timeouts is different from being down by nine. Down six, timeouts help manage the clock. Down nine, they’re less useful as you need two scores.
Why three timeouts trailing by 6 is fundamentally different from trailing by 9
Understanding this difference can change your betting strategy. The market often gets these scenarios wrong, using a generic approach. Knowing when a timeout is key can make you stand out.
Building a live moneyline model that updates after every play
Creating a good live moneyline model means updating it after each play. It’s important to include defensive fatigue. A tired defense performs differently than a fresh one.
As the game goes on, tackling gets worse and coverage lapses happen more often.
Incorporating defensive fatigue and prevent-defense effects into the fourth quarter
Your model should adjust for these changes. This way, it can better predict a team’s chances. This makes your live betting strategy stronger.
| Situation | Time Remaining | Timeouts Left | Live Moneyline | Estimated Probability |
|---|---|---|---|---|
| Trailing by 4 | 3:12 | 2 | +280 | 34% |
| Trailing by 6 | 2:45 | 3 | +300 | 30% |
| Trailing by 9 | 1:50 | 1 | +400 | 22% |
Threshold design bet or pass hysteresis and cooldown rules
Live betting is more than just guessing. It’s about following rules that guide your choices. Setting clear bet/no-bet limits is key in the fast-changing world of live betting. With higher odds in live markets, a small edge can quickly turn into a big loss. You must be smarter than that.
Why Every Live Betting Model Needs Explicit Bet/No-Bet Thresholds
In live betting, the math is tough. You need to make sure your chances of winning are much higher than what the odds suggest. With pregame odds around 4.5%, a small edge can help. But in live betting, where odds can jump to 8-10%, that edge can be misleading. To do well, aim for a 5% edge. Less than that, and you’re taking a big risk.
The Difference Between a 2% Edge and a 5% Edge When Vig is 8%
Imagine your model says you have a 52% chance of winning, but the odds suggest 48%. That’s a 4% edge, which is too low. If the odds change to 47%, your edge jumps to 5%, and you bet. But if they go back to 48%, you pass again. This back-and-forth can be frustrating.
Hysteresis Logic for Preventing Oscillation Between Bet and Pass States
Hysteresis logic helps avoid this back-and-forth. Set your thresholds with a buffer zone. Bet when your edge is over 5% but stop betting when it falls below 3%. This stops the flip-flop that can ruin a good strategy.
How to Design Thresholds That Don’t Flip-Flop with Every Minor Odds Twitch
The market doesn’t care about your feelings. It only looks at the numbers. A good threshold system keeps you focused on the data, not the noise.
Cooldown Rules and Session-Level Exposure Management
Cooldown rules are important too. After a bet, wait at least three minutes before betting again. This pause helps you think clearly without being rushed. If you lose, wait even longer. After two losses in a row, stop betting for the day. Your brain isn’t as sharp after a loss as it was before.
Why the Best Live Bettors Have Rules That Force Them to Stop Betting
These rules are in place for a reason. They help control your emotions and keep your betting strategy on track. In live betting, where timing is everything, these rules can make all the difference between winning and losing big.
Risk controls liquidity limits hedging and correlation across books
Live betting is complex and requires a deep understanding of risk controls. The odds can change quickly, and sportsbooks take steps to protect themselves. Knowing the betting limits at your sportsbook is key.
Ever tried to place a big bet only to be turned down? This is common due to liquidity constraints. If you can’t bet as much as you want, consider splitting your bets across different sportsbooks.
Live odds vary more than pregame lines because each sportsbook’s algorithm is different. It’s like a race with unique strategies for each participant. Have accounts at 2-3 sportsbooks and compare prices before betting live.
Hedging strategies for live positions that move against you
Hedging live bets is a complex decision. You might have bet on an underdog at +350, but now it’s +150. Do you hedge to secure a profit or let it ride? The choice depends on your bankroll and risk tolerance.
When to hedge versus when to let a positive-EV position ride
Psychologically, hedging can be tempting to avoid losses. It’s about balancing risk and reward.
Correlation risk across simultaneous live positions
Correlation risk can be deadly. Betting on the same team in different ways can increase your risk. A high-scoring game can affect both your bets, making your exposure larger than expected.
Why betting both sides of a correlated market destroys your edge
Aggregate correlated positions and manage your total exposure. Sportsbooks watch your bets and adjust their algorithms. Stay sharp to protect your edge!
Postmatch audit timestamp reconciliation and expected vs realized edge
The game ends, and you either win or lose. But that’s just the start. The postmatch audit is where the real work begins. Many bettors skip this step, thinking it’s boring. They miss out on learning and growing.
Reconstructing the betting timeline for every live wager placed
Start by tracking every live bet you place. Record the sport, market, odds, and your estimated probability. A simple spreadsheet works well. Note the date, game, market type, and results. After 50 to 100 bets, analyze your data.
Are you profitable in certain sports or market types? Which bets are impulsive and outside your framework?
Timestamp reconciliation between your model your execution and the book’s record
Each bet has a timeline. Your model may log a bet at 8:42 PM, but the sportsbook’s record shows 8:42:17 PM. This gap could indicate latency control issues or a clock drift. Understanding these discrepancies is vital.
They could reveal where your expected edge becomes fiction.
Expected edge versus realized outcome and the danger of small-sample conclusions
Let’s face it: variance in live betting can be brutal. You might place 50 bets with an average expected edge of 4.8%, yet see a negative return. Are you a bad bettor or just unlucky? The truth is, with such a small sample, you can’t know for sure.
Why 50 live bets tell you almost nothing about your true edge
Tracking closing line value is more important than wins and losses in the short term. If you consistently beat the closing line, your process is solid. The variance may just be working against you.
Building a postmatch audit workflow that improves your model over time
Segment your performance by model class and market type. Maybe your hazard models excel in certain markets but falter in others. Without this granular analysis, you’ll keep betting blindly, unaware of what works and what doesn’t.
Tracking which state representations and model classes actually generate profit
The audit is your feedback loop. It transforms a static model into a dynamic edge. Skip it, and you’re merely gambling with extra steps. Embrace the audit process, and let it guide your betting journey.